Well as you may have guessed by the link above, I have moved my blogging endeavours. Although I'm sure the good people at Blogger won't take it personally, I'd like to reassure them that they shouldn't.
As I've explained to a few others in person, the format at Edublogs is a little less intimidating for new users and to promote the use of blogs in the classroom I feel that using the more easily accessible format is important for now. As students and other teachers become more comfortable with publishing to the web in the "blog" format they will certainly find their way to Blogger. Essentially Edublogs provides a little more in what I call "mouse wiggles" usability; which is less intimidating in comparison to copying and pasting code for the newly initiated.
To the good folks working at Blogger however, I'd like to say not to change too much. The control one has over their blog by having some access to the html code which creates it is an important feature and one I will miss (and will be suggesting to the people of Edublogs).
Again, thank you to the Blogger staff, and to those of you who helped me to build this blog. Visit me at the new blog by following the link above.
C'ya there!
Thursday, November 30, 2006
Friday, November 17, 2006
The Lost Lab
Hope everyone is able to get out and enjoy some of the nice weather which has been forcasted for the weekend. For those who are using every last minute to perfect their labs which are due Monday I appriciate your effort.
For those of you who may have lost your stuff...follow the link.
Enjoy the weekend!
For those of you who may have lost your stuff...follow the link.
Enjoy the weekend!
Wednesday, November 08, 2006
Pre-Calc 20
Today we contiued work on our study guides. Unfortunately the study guide is too large to post, so you'll have to come to class to get it. Be sure to go over your old tests in the meantime.
Good luck studying.
Good luck studying.
Math 9: Study Guide for Midterm Exam

If you follow the link you will find a study guide in Word format as well as Open Office. Both should download fine. Make sure you have completed your homework sheets that have been assigned after our last test as they will be on the exam as well.
Your exam will consist of solving equations, some word problems, and some exponents.
Study hard.
Physics 11 Study Guide for the Midterm Exam
We have completed a number of topics so far. They include:
- 1.5: Analysis of Straight-line D vs. T Graphs.
- 2.1: Analysis of Velocity-Time Graphs
- 2.2: Moving from Velocity-Time to Distance-Time
- 2.4: Using Equations to Solve Problems
- Conceptual Questions (pg68):#1, #3, #4 (hint: Acceleration occurs when there is a net force)
- 4.2: Newton's Second Law
- 4.3: Free Body Diagrams
- 4.4: FBD's in Two Dimensions #44 only
- Conceptual Questions (pg149): #1, #2, #8
- 5.3: Calculations Involving the Force of Gravity
- 5.4: The Normal Force
- 5.5: Friction (This is my favorite topic so far...be prepared!)
- 5.6: Springs (Surprisingly few questions from you here...hummm...did anyone do the homework?)
- Conceptual Questions (pg186): #3, #6, #19 (look this one up), and any others that may have appeared in our work.
- 10.1: Introduction to Waves
- 10.2: The Wave Equation
You will be given a formula sheet with constants and prefixes. Be sure to bring a CALCULATOR and a RULER. I will not be able to provide you with these once you're at the exam. Study well. When we return to school I will give you time to study and work on your labs (Due November 20).
Tuesday, November 07, 2006
Pre-Calc 40 Study Guide
This link will take you to a website for Pre-Calculus 40. Your midterm exam will be based on the first four practice exams given to you on the site (Trig 1 & 2, Transformations, and Logarithms).
Each of these represents the four modules we have covered so far. Each of the modules will be weighted equally.
When you're preparing for your exam remember that even if you can't solve a particular problem, there will be a possibility of part marks, so show your work for the portion you know and move on.
Wednesday, October 25, 2006
The Logarithmic Function
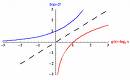
Previously we were graphing exponential equations in all bases (including base e), and in our assignment we graphed the reflections of these functions in the line y=x (the inverse functions...right?)
Those inverse functions you graphed are called Logarithms. Logarithms are exponents and will be manipulated with the same rules as any other exponents (to be discussed later). Lets take a look at how a logarithmic function is written.
An exponential function can be written as:

So exchanging the x and y coordinates produces yesterday's inverses, which can be written like:

Or in logarithmic form the above looks like:

For this lesson we will concern ourselves with developing skill in sketching these functions. Look for similarities and differences between these and their exponential cousins (inverses). Tomorrow we will do some converting between the exponential and logarithmic forms of these functions.
Tuesday, October 24, 2006
A "Special" Exponential Function
This link (purplemath comes through yet again) describes what the "base e" is without going into too much mathematical "hocus pocus". Understanding this will help later on when you're answering questions and wondering what "continuous" meant in a mathematical sense.
(I'll wait here while you read the linked site)

So hopefully you're ready to graph some equations using the base e now...take a look at example 1 in your module and give it a try.
When you get to your assignment (specifically question #2) try to remember that to sketch an inverse of a function (not the reciprocal) you reflect the function in the line y=x. When the assignment moves on to talking about geometric series I suggest you read question 5 first.
(I'll wait here while you read the linked site)
So hopefully you're ready to graph some equations using the base e now...take a look at example 1 in your module and give it a try.
When you get to your assignment (specifically question #2) try to remember that to sketch an inverse of a function (not the reciprocal) you reflect the function in the line y=x. When the assignment moves on to talking about geometric series I suggest you read question 5 first.
Monday, October 23, 2006
Exponential Equations
The link above will take you to the Pre-Calculus site on Logarithms. Logaritms is a tool we use to solve exponential equations. As with all of our other studies, we will begin with graphing exponential equations, then we will move to solving them for particular values.
Graphing an exponential equation will be just like graphing any other equation we have studied so far. You can start with a table of values. Eventually we will notice some patterns and be able to graph by inspection of the equation. Let's start with a few characteristics of all exponential equations.
1.They pass through the point (0,1).
2.D: {all real numbers}
3.R: (0, ∞)
4.They have y=0 as an asymptote.
Of course we can apply other translations to exponential functions just as we have with every other function we have studied. I strongly recommend completing example 2 in the module to get a feel for the other types of translations.
Once we have developed some comfort with these equations we will begin to solve for x. We have already seen this type of question (take a look at example 1) by finding a common base. Try the following one if you like.

After we are familiar with exponential equations and their graphs we will solve equations that do not have a common base.
Friday, September 22, 2006
PC40: Exact Values and other fairly precise stuff.

The link here provides a nice introduction to a few of the concepts we're working with in this module. If you follow the links on the left sidebar the site goes on to explain some other things that we will be covering very soon. Be sure to check out the PC40 Explained site for some definitions and examples as well.
Thursday, September 21, 2006
Precalculus 20: Back in the saddle...exponentially.

Whew! The last unit was a bit tough at the end but it's over for now. Today we revisit an old topic: Exponents and Negatives (otherwise called Integral Exponents). If you follow the link you'll find a short explanation with plenty of examples.
By the way...I found a new website for math help. I don't know if you've tried the others yet but this one has exponent help here
Physics 11: ...and now ladies and gentlemen, the formulas.

Ah yes, the graphing thing is over, but it leads to our next step....using equations to solve problems involving motion. The link introduces four equations you will need to be able to use but there is a fifth equation that is usuful sometimes. You can find it in section 2.3 of your book.
Just remember that two of these equations are simply expressions of either the slope of a graph, or the area under the curve. The others are found by substituting expressions from one equation into another.
One more thing...who is this? (hint: despite the hair...not from the 80's)
Wednesday, September 20, 2006
Physics 11: Thanks for the link!
So this is a link that sort of demonstrates what we were trying to understand today about the difference between average and instantaneous velocities. There's a lot of math stuff that you need not worry about, just scroll down and take a look at the animated graph (it's the third graph with the moving green line).
As the two points move closer together you move towards a more accurate value for the instantaneous velocity.
As the two points move closer together you move towards a more accurate value for the instantaneous velocity.
Friday, September 15, 2006
Physics 11: Our first lab!
Over the last week we've been learning how to work with graphs of distance vs. time, and velocity vs. time. Now it's time to try it out for ourselves. You've been given two sets of data. One is distance vs. time and the other is velocity vs. time. What I'd like you to do now is:
- produce a graph for each set of data
- from the distance vs. time graph determine the maximum velocity (slope of a tangent line), average velocity (total distance divided by total time), and total displacement.
- from the velocity vs. time graph determine the maximum velocity, and displacement (the area under the line).
Be sure to follow the guidelines we copied into our notes about what a good graph looks like and show your work and calculations on a separate page for each graph (If it's organized with titles it's so much easier to mark).
Also, be sure to add a paragraph or two describing the motion and what you sort of graph you should get (Theory section). Compare the data in relation to the motion you obsevered in class (not all of the data will make sense at first...explain why-Discussion section). State the values you calculate (Conclusions). Good luck.
Tuesday, September 12, 2006
Pre-Calc 20
The simplification of radical expressions can be difficult when you first start to work with them (as most things in math can be). The link (click on the title of this post) will take you to an explanation in PurpleMath which might be helpful. The pages that continue on are topics we will cover eventually so don't be worried if you move on through the pages and none of it makes sense...we just haven't talked about it yet.
As I mentioned to the PC 40 class, we'll be needing a quiz before long...I was thinking Friday.
As I mentioned to the PC 40 class, we'll be needing a quiz before long...I was thinking Friday.
Physics 11: Graphing Motion
I hope the demonstration in class today was helpful. I know some of you would like some more practice and explanation before we move on. I found this website (follow the link from the title of this post), which might help explain some of the things we've been discussing in class. The site is good, but can take a little while to load so be patient...it's worth the wait. It even has a few questions you can answer at the end to check your understanding.
Pre-Calc 12: Horizontal & Vertical Stretches and Compressions
I did a little digging around in PurpleMath and found this site. It explains things pretty well if you were needing a little extra explanation before tomorrow. If you follow the four different pages, it follows up with a little quiz at the end too. Let me know if you give it a try.
Oh, we'll be needing a quiz before long as well. I was thinking Friday.
Oh, we'll be needing a quiz before long as well. I was thinking Friday.
Monday, September 11, 2006
Help for Math Students
Often when I work with a class and try to find another way to explain something, I discover something new. During the last few years I have been using Google to find study solutions for my students. Today I found PurpleMath.
I haven't had a chance to go through it in detail, but for the topics I'm currently covering, and the ones I expect to cover soon, this website does seem to have what you might be looking for. If you happen to come across another site you have found helpful let us know and share.
I haven't had a chance to go through it in detail, but for the topics I'm currently covering, and the ones I expect to cover soon, this website does seem to have what you might be looking for. If you happen to come across another site you have found helpful let us know and share.
Physics 11
Graphs give us a great deal of information. We can read values from them, determine their slope, or find the area under the curve. For now we will work mostly with slopes of distance vs time graphs (which give velocity), and areas under a velocity vs time graph (which gives displacement).
As I mentioned today, we'll plan to have a quiz on Thursday which will include homework assigned up to now and tomorrow. Make sure you're up to date.
As I mentioned today, we'll plan to have a quiz on Thursday which will include homework assigned up to now and tomorrow. Make sure you're up to date.
Subscribe to:
Posts (Atom)

